- Home
- Quintessential Queensland
- Distinctiveness
- Perceptions
- Perceptions: how people understand the landscape
- From runs to closer settlement
- Geological survey of Queensland
- Mapping a new colony, 1860-80
- Mapping the Torres Strait: from TI to Magani Malu and Zenadh Kes
- Order in Paradise: a colonial gold field
- Queensland atlas, 1865
- Queensland mapping since 1900
- Queensland: the slogan state
- Rainforests of North Queensland
- Walkabout
- Queenslanders
- Queenslanders: people in the landscape
- Aboriginal heroes: episodes in the colonial landscape
- Australian South Sea Islanders
- Cane fields and solidarity in the multiethnic north
- Chinatowns
- Colonial immigration to Queensland
- Greek Cafés in the landscape of Queensland
- Hispanics and human rights in Queensland’s public spaces
- Italians in north Queensland
- Lebanese in rural Queensland
- Queensland clothing
- Queensland for ‘the best kind of population, primary producers’
- Too remote, too primitive and too expensive: Scandinavian settlers in colonial Queensland
- Distance
- Movement
- Movement: how people move through the landscape
- Air travel in Queensland
- Bicycling through Brisbane, 1896
- Cobb & Co
- Journey to Hayman Island, 1938
- Law and story-strings
- Mobile kids: children’s explorations of Cherbourg
- Movable heritage of North Queensland
- Passages to India: military linkages with Queensland
- The Queen in Queensland, 1954
- Transient Chinese in colonial Queensland
- Travelling times by rail
- Pathways
- Pathways: how things move through the landscape and where they are made
- Aboriginal dreaming paths and trading ways
- Chinese traders in the nineteenth century
- Introducing the cane toad
- Pituri bag
- Press and the media
- Radio in Queensland
- Red Cross Society and World War I in Queensland
- The telephone in Queensland
- Where did the trams go?
- ‘A little bit of love for me and a murder for my old man’: the Queensland Bush Book Club
- Movement
- Division
- Separation
- Separation: divisions in the landscape
- Asylums in the landscape
- Brisbane River
- Changing landscape of radicalism
- Civil government boundaries
- Convict Brisbane
- Dividing Queensland - Pauline Hanson’s One Nation Party
- High water mark: the shifting electoral landscape 2001-12
- Hospitals in the landscape
- Indigenous health
- Palm Island
- Secession movements
- Separate spheres: gender and dress codes
- Separating land, separating culture
- Stone walls do a prison make: law on the landscape
- The 1967 Referendum – the State comes together?
- Utopian communities
- Whiteness in the tropics
- Conflict
- Conflict: how people contest the landscape
- A tale of two elections – One Nation and political protest
- Battle of Brisbane – Australian masculinity under threat
- Dangerous spaces - youth politics in Brisbane, 1960s-70s
- Fortress Queensland 1942-45
- Grassy hills: colonial defence and coastal forts
- Great Shearers’ Strike of 1891
- Iwasaki project
- Johannes Bjelke-Petersen: straddling a barbed wire fence
- Mount Etna: Queensland's longest environmental conflict
- Native Police
- Skyrail Cairns (Research notes)
- Staunch but conservative – the trade union movement in Rockhampton
- The Chinese question
- Thomas Wentworth Wills and Cullin-la-ringo Station
- Separation
- Dreaming
- Imagination
- Imagination: how people have imagined Queensland
- Brisbane River and Moreton Bay: Thomas Welsby
- Changing views of the Glasshouse Mountains
- Imagining Queensland in film and television production
- Jacaranda
- Literary mapping of Brisbane in the 1990s
- Looking at Mount Coot-tha
- Mapping the Macqueen farm
- Mapping the mythic: Hugh Sawrey's ‘outback’
- People’s Republic of Woodford
- Poinsettia city: Brisbane’s flower
- The Pineapple Girl
- The writers of Tamborine Mountain
- Vance and Nettie Palmer
- Memory
- Memory: how people remember the landscape
- Anna Wickham: the memory of a moment
- Berajondo and Mill Point: remembering place and landscape
- Cemeteries in the landscape
- Landscapes of memory: Tjapukai Dance Theatre and Laura Festival
- Monuments and memory: T.J. Byrnes and T.J. Ryan
- Out where the dead towns lie
- Queensland in miniature: the Brisbane Exhibition
- Roadside ++++ memorials
- Shipwrecks as graves
- The Dame in the tropics: Nellie Melba
- Tinnenburra
- Vanished heritage
- War memorials
- Curiosity
- Curiosity: knowledge through the landscape
- A playground for science: Great Barrier Reef
- Duboisia hopwoodii: a colonial curiosity
- Great Artesian Basin: water from deeper down
- In search of Landsborough
- James Cook’s hundred days in Queensland
- Mutual curiosity – Aboriginal people and explorers
- Queensland Acclimatisation Society
- Queensland’s own sea monster: a curious tale of loss and regret
- St Lucia: degrees of landscape
- Townsville’s Mount St John Zoo
- Imagination
- Development
- Exploitation
- Transformation
- Transformation: how the landscape has changed and been modified
- Cultivation
- Empire and agribusiness: the Australian Mercantile Land and Finance Company
- Gold
- Kill, cure, or strangle: Atherton Tablelands
- National parks in Queensland
- Pastoralism 1860s–1915
- Prickly pear
- Repurchasing estates: the transformation of Durundur
- Soil
- Sugar
- Sunshine Coast
- The Brigalow
- Walter Reid Cultural Centre, Rockhampton: back again
- Survival
- Survival: how the landscape impacts on people
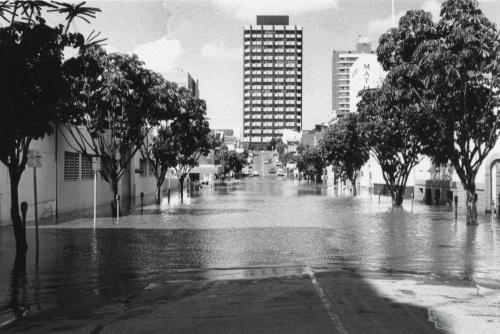
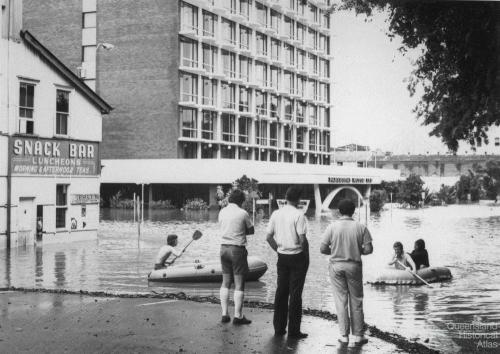
- Brisbane floods: 1893 to the summer of sorrow
- City of the Damned: how the media embraced the Brisbane floods
- Depression era
- Did Clem Jones save Brisbane from flood?
- Droughts and floods and rail
- Missions and reserves
- Queensland British Food Corporation
- Rockhampton’s great flood of 1918
- Station homesteads
- Tropical cyclones
- Wreck of the Quetta
- Pleasure
- Pleasure: how people enjoy the landscape
- Bushwalking in Queensland
- Cherbourg that’s my home: celebrating landscape through song
- Creating rural attractions
- Festivals
- Queer pleasure: masculinity, male homosexuality and public space
- Railway refreshment rooms
- Regional cinema
- Schoolies week: a festival of misrule
- The sporting landscape
- Visiting the Great Barrier Reef


Copyright © Queensland Historical Atlas, 2026. All rights reserved.
ISSN 1838-708X
![]()
![]()
![]()