- Home
- Quintessential Queensland
- Distinctiveness
- Perceptions
- Perceptions: how people understand the landscape
- From runs to closer settlement
- Geological survey of Queensland
- Mapping a new colony, 1860-80
- Mapping the Torres Strait: from TI to Magani Malu and Zenadh Kes
- Order in Paradise: a colonial gold field
- Queensland atlas, 1865
- Queensland mapping since 1900
- Queensland: the slogan state
- Rainforests of North Queensland
- Walkabout
- Queenslanders
- Queenslanders: people in the landscape
- Aboriginal heroes: episodes in the colonial landscape
- Australian South Sea Islanders
- Cane fields and solidarity in the multiethnic north
- Chinatowns
- Colonial immigration to Queensland
- Greek Cafés in the landscape of Queensland
- Hispanics and human rights in Queensland’s public spaces
- Italians in north Queensland
- Lebanese in rural Queensland
- Queensland clothing
- Queensland for ‘the best kind of population, primary producers’
- Too remote, too primitive and too expensive: Scandinavian settlers in colonial Queensland
- Distance
- Movement
- Movement: how people move through the landscape
- Air travel in Queensland
- Bicycling through Brisbane, 1896
- Cobb & Co
- Journey to Hayman Island, 1938
- Law and story-strings
- Mobile kids: children’s explorations of Cherbourg
- Movable heritage of North Queensland
- Passages to India: military linkages with Queensland
- The Queen in Queensland, 1954
- Transient Chinese in colonial Queensland
- Travelling times by rail
- Pathways
- Pathways: how things move through the landscape and where they are made
- Aboriginal dreaming paths and trading ways
- Chinese traders in the nineteenth century
- Introducing the cane toad
- Pituri bag
- Press and the media
- Radio in Queensland
- Red Cross Society and World War I in Queensland
- The telephone in Queensland
- Where did the trams go?
- ‘A little bit of love for me and a murder for my old man’: the Queensland Bush Book Club
- Movement
- Division
- Separation
- Separation: divisions in the landscape
- Asylums in the landscape
- Brisbane River
- Changing landscape of radicalism
- Civil government boundaries
- Convict Brisbane
- Dividing Queensland - Pauline Hanson’s One Nation Party
- High water mark: the shifting electoral landscape 2001-12
- Hospitals in the landscape
- Indigenous health
- Palm Island
- Secession movements
- Separate spheres: gender and dress codes
- Separating land, separating culture
- Stone walls do a prison make: law on the landscape
- The 1967 Referendum – the State comes together?
- Utopian communities
- Whiteness in the tropics
- Conflict
- Conflict: how people contest the landscape
- A tale of two elections – One Nation and political protest
- Battle of Brisbane – Australian masculinity under threat
- Dangerous spaces - youth politics in Brisbane, 1960s-70s
- Fortress Queensland 1942-45
- Grassy hills: colonial defence and coastal forts
- Great Shearers’ Strike of 1891
- Iwasaki project
- Johannes Bjelke-Petersen: straddling a barbed wire fence
- Mount Etna: Queensland's longest environmental conflict
- Native Police
- Skyrail Cairns (Research notes)
- Staunch but conservative – the trade union movement in Rockhampton
- The Chinese question
- Thomas Wentworth Wills and Cullin-la-ringo Station
- Separation
- Dreaming
- Imagination
- Imagination: how people have imagined Queensland
- Brisbane River and Moreton Bay: Thomas Welsby
- Changing views of the Glasshouse Mountains
- Imagining Queensland in film and television production
- Jacaranda
- Literary mapping of Brisbane in the 1990s
- Looking at Mount Coot-tha
- Mapping the Macqueen farm
- Mapping the mythic: Hugh Sawrey's ‘outback’
- People’s Republic of Woodford
- Poinsettia city: Brisbane’s flower
- The Pineapple Girl
- The writers of Tamborine Mountain
- Vance and Nettie Palmer
- Memory
- Memory: how people remember the landscape
- Anna Wickham: the memory of a moment
- Berajondo and Mill Point: remembering place and landscape
- Cemeteries in the landscape
- Landscapes of memory: Tjapukai Dance Theatre and Laura Festival
- Monuments and memory: T.J. Byrnes and T.J. Ryan
- Out where the dead towns lie
- Queensland in miniature: the Brisbane Exhibition
- Roadside ++++ memorials
- Shipwrecks as graves
- The Dame in the tropics: Nellie Melba
- Tinnenburra
- Vanished heritage
- War memorials
- Curiosity
- Curiosity: knowledge through the landscape
- A playground for science: Great Barrier Reef
- Duboisia hopwoodii: a colonial curiosity
- Great Artesian Basin: water from deeper down
- In search of Landsborough
- James Cook’s hundred days in Queensland
- Mutual curiosity – Aboriginal people and explorers
- Queensland Acclimatisation Society
- Queensland’s own sea monster: a curious tale of loss and regret
- St Lucia: degrees of landscape
- Townsville’s Mount St John Zoo
- Imagination
- Development
- Exploitation
- Transformation
- Transformation: how the landscape has changed and been modified
- Cultivation
- Empire and agribusiness: the Australian Mercantile Land and Finance Company
- Gold
- Kill, cure, or strangle: Atherton Tablelands
- National parks in Queensland
- Pastoralism 1860s–1915
- Prickly pear
- Repurchasing estates: the transformation of Durundur
- Soil
- Sugar
- Sunshine Coast
- The Brigalow
- Walter Reid Cultural Centre, Rockhampton: back again
- Survival
- Survival: how the landscape impacts on people
- Brisbane floods: 1893 to the summer of sorrow
- City of the Damned: how the media embraced the Brisbane floods
- Depression era
- Did Clem Jones save Brisbane from flood?
- Droughts and floods and rail
- Missions and reserves
- Queensland British Food Corporation
- Rockhampton’s great flood of 1918
- Station homesteads
- Tropical cyclones
- Wreck of the Quetta
- Pleasure
- Pleasure: how people enjoy the landscape
- Bushwalking in Queensland
- Cherbourg that’s my home: celebrating landscape through song
- Creating rural attractions
- Festivals
- Queer pleasure: masculinity, male homosexuality and public space
- Railway refreshment rooms
- Regional cinema
- Schoolies week: a festival of misrule
- The sporting landscape
- Visiting the Great Barrier Reef
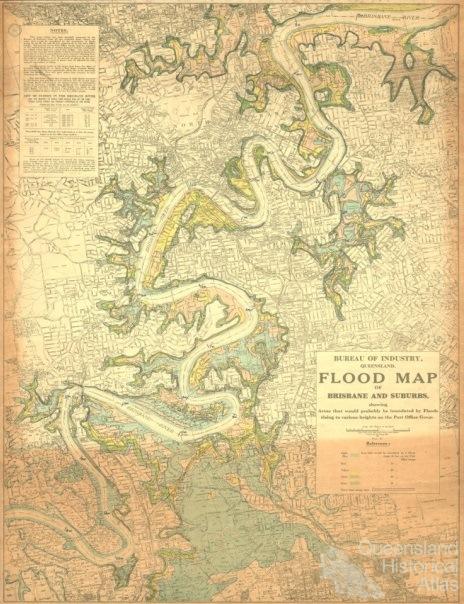
Brisbane flood prediction map, 1933. Drawn by the Survey Office, this map was prepared by the Bureau of Industry in 1933. At the time it provided information on which areas of Brisbane were likely to be inundated under various flood scenarios: 10, 15, 20, 25 and 30 feet. These areas were shaded blue, pink, yellow, green and plum respectively. Because ‘improvements’ (dredging and channel widening) had been made in the lower river, flood heights were expected to be at least four feet lower from the Victoria Bridge downstream, however, no appreciable effects were expected upstream. The map contained a list of major floods since 1841 as well as a table estimating the probable duration of floods at different heights. The last major flood was on 7 February 1931 which rose just below 15 feet. Its approximate extent can be inferred from the areas shaded red. According to the map, 15 feet at the Port Office gauge was the ‘critical level’ where ‘no serious damage need be anticipated by a flood which does not exceed that height.’ A flood around 15 feet or below would not be treated as lightly. The cost of this map was three shillings. Collection of the Museum of Lands, Surveying and Mapping
Publisher:
Department of Lands
Date captured:
15 April 2015
Date created:
15 April 2015
Rights:
Collection of the Museum of Lands, Surveying and Mapping