- Home
- Quintessential Queensland
- Distinctiveness
- Perceptions
- Perceptions: how people understand the landscape
- From runs to closer settlement
- Geological survey of Queensland
- Mapping a new colony, 1860-80
- Mapping the Torres Strait: from TI to Magani Malu and Zenadh Kes
- Order in Paradise: a colonial gold field
- Queensland atlas, 1865
- Queensland mapping since 1900
- Queensland: the slogan state
- Rainforests of North Queensland
- Walkabout
- Queenslanders
- Queenslanders: people in the landscape
- Aboriginal heroes: episodes in the colonial landscape
- Australian South Sea Islanders
- Cane fields and solidarity in the multiethnic north
- Chinatowns
- Colonial immigration to Queensland
- Greek Cafés in the landscape of Queensland
- Hispanics and human rights in Queensland’s public spaces
- Italians in north Queensland
- Lebanese in rural Queensland
- Queensland clothing
- Queensland for ‘the best kind of population, primary producers’
- Too remote, too primitive and too expensive: Scandinavian settlers in colonial Queensland
- Distance
- Movement
- Movement: how people move through the landscape
- Air travel in Queensland
- Bicycling through Brisbane, 1896
- Cobb & Co
- Journey to Hayman Island, 1938
- Law and story-strings
- Mobile kids: children’s explorations of Cherbourg
- Movable heritage of North Queensland
- Passages to India: military linkages with Queensland
- The Queen in Queensland, 1954
- Transient Chinese in colonial Queensland
- Travelling times by rail
- Pathways
- Pathways: how things move through the landscape and where they are made
- Aboriginal dreaming paths and trading ways
- Chinese traders in the nineteenth century
- Introducing the cane toad
- Pituri bag
- Press and the media
- Radio in Queensland
- Red Cross Society and World War I in Queensland
- The telephone in Queensland
- Where did the trams go?
- ‘A little bit of love for me and a murder for my old man’: the Queensland Bush Book Club
- Movement
- Division
- Separation
- Separation: divisions in the landscape
- Asylums in the landscape
- Brisbane River
- Changing landscape of radicalism
- Civil government boundaries
- Convict Brisbane
- Dividing Queensland - Pauline Hanson’s One Nation Party
- High water mark: the shifting electoral landscape 2001-12
- Hospitals in the landscape
- Indigenous health
- Palm Island
- Secession movements
- Separate spheres: gender and dress codes
- Separating land, separating culture
- Stone walls do a prison make: law on the landscape
- The 1967 Referendum – the State comes together?
- Utopian communities
- Whiteness in the tropics
- Conflict
- Conflict: how people contest the landscape
- A tale of two elections – One Nation and political protest
- Battle of Brisbane – Australian masculinity under threat
- Dangerous spaces - youth politics in Brisbane, 1960s-70s
- Fortress Queensland 1942-45
- Grassy hills: colonial defence and coastal forts
- Great Shearers’ Strike of 1891
- Iwasaki project
- Johannes Bjelke-Petersen: straddling a barbed wire fence
- Mount Etna: Queensland's longest environmental conflict
- Native Police
- Skyrail Cairns (Research notes)
- Staunch but conservative – the trade union movement in Rockhampton
- The Chinese question
- Thomas Wentworth Wills and Cullin-la-ringo Station
- Separation
- Dreaming
- Imagination
- Imagination: how people have imagined Queensland
- Brisbane River and Moreton Bay: Thomas Welsby
- Changing views of the Glasshouse Mountains
- Imagining Queensland in film and television production
- Jacaranda
- Literary mapping of Brisbane in the 1990s
- Looking at Mount Coot-tha
- Mapping the Macqueen farm
- Mapping the mythic: Hugh Sawrey's ‘outback’
- People’s Republic of Woodford
- Poinsettia city: Brisbane’s flower
- The Pineapple Girl
- The writers of Tamborine Mountain
- Vance and Nettie Palmer
- Memory
- Memory: how people remember the landscape
- Anna Wickham: the memory of a moment
- Berajondo and Mill Point: remembering place and landscape
- Cemeteries in the landscape
- Landscapes of memory: Tjapukai Dance Theatre and Laura Festival
- Monuments and memory: T.J. Byrnes and T.J. Ryan
- Out where the dead towns lie
- Queensland in miniature: the Brisbane Exhibition
- Roadside ++++ memorials
- Shipwrecks as graves
- The Dame in the tropics: Nellie Melba
- Tinnenburra
- Vanished heritage
- War memorials
- Curiosity
- Curiosity: knowledge through the landscape
- A playground for science: Great Barrier Reef
- Duboisia hopwoodii: a colonial curiosity
- Great Artesian Basin: water from deeper down
- In search of Landsborough
- James Cook’s hundred days in Queensland
- Mutual curiosity – Aboriginal people and explorers
- Queensland Acclimatisation Society
- Queensland’s own sea monster: a curious tale of loss and regret
- St Lucia: degrees of landscape
- Townsville’s Mount St John Zoo
- Imagination
- Development
- Exploitation
- Transformation
- Transformation: how the landscape has changed and been modified
- Cultivation
- Empire and agribusiness: the Australian Mercantile Land and Finance Company
- Gold
- Kill, cure, or strangle: Atherton Tablelands
- National parks in Queensland
- Pastoralism 1860s–1915
- Prickly pear
- Repurchasing estates: the transformation of Durundur
- Soil
- Sugar
- Sunshine Coast
- The Brigalow
- Walter Reid Cultural Centre, Rockhampton: back again
- Survival
- Survival: how the landscape impacts on people
- Brisbane floods: 1893 to the summer of sorrow
- City of the Damned: how the media embraced the Brisbane floods
- Depression era
- Did Clem Jones save Brisbane from flood?
- Droughts and floods and rail
- Missions and reserves
- Queensland British Food Corporation
- Rockhampton’s great flood of 1918
- Station homesteads
- Tropical cyclones
- Wreck of the Quetta
- Pleasure
- Pleasure: how people enjoy the landscape
- Bushwalking in Queensland
- Cherbourg that’s my home: celebrating landscape through song
- Creating rural attractions
- Festivals
- Queer pleasure: masculinity, male homosexuality and public space
- Railway refreshment rooms
- Regional cinema
- Schoolies week: a festival of misrule
- The sporting landscape
- Visiting the Great Barrier Reef

By:
Les Isdale Every stage in the mapping of Queensland reflects both the changing perceptions of the country, and the state of contemporary technology. Fitness for purpose meant that orders of accuracy sufficient for early settlement needed to be constantly improved to meet the demands of urbanisation. The skeletal cadastral and planimetric base served only until the full range of topographic and thematic information could be realised in modern maps.
By 1900, the establishment of a basic planimetry had been accomplished, based on the work of early explorers, navigators and surveyors. The search for resources – minerals, forests, pastures and fisheries – continued under an economic impetus for national and commercial development.
The sense of stewardship of the land so strongly marked in Aboriginal culture informed much of early official and private land administration and use, but a wider understanding of the limitations implicit in sustainable land use was a vision that marked the period post-World War II. Topographic and resources mapping assisted in this developing awareness, and with the later development of geographic information systems helped avoid inappropriate uses, and illustrate the possibilities and development potential of the state.
With increased urbanisation of Queensland, large scale map coverage by the Survey Office was progressively extended. In the period 1900-2006, Queensland’s population increased about eight times, from less than half a million. For mapping, as with most services, the vast size of the state constituted a major problem, with an area of 1,727,200 square kilometres, and a 7400 kilometre coastline.
The cadastre
Queensland entered the twentieth century with an economy dominated by rural industries, pastoral and agricultural. Rural properties were usually leasehold, administered by the Department of Public Lands. These leases comprised two-thirds of the state.
To facilitate this administration, land boundary (cadastral) maps were provided by the technical branch of the Department, the Survey Office. In the eastern part of the state these maps were published at 40 chains to one inch, as Parish maps, island shaped, rather than as regular sheet maps.
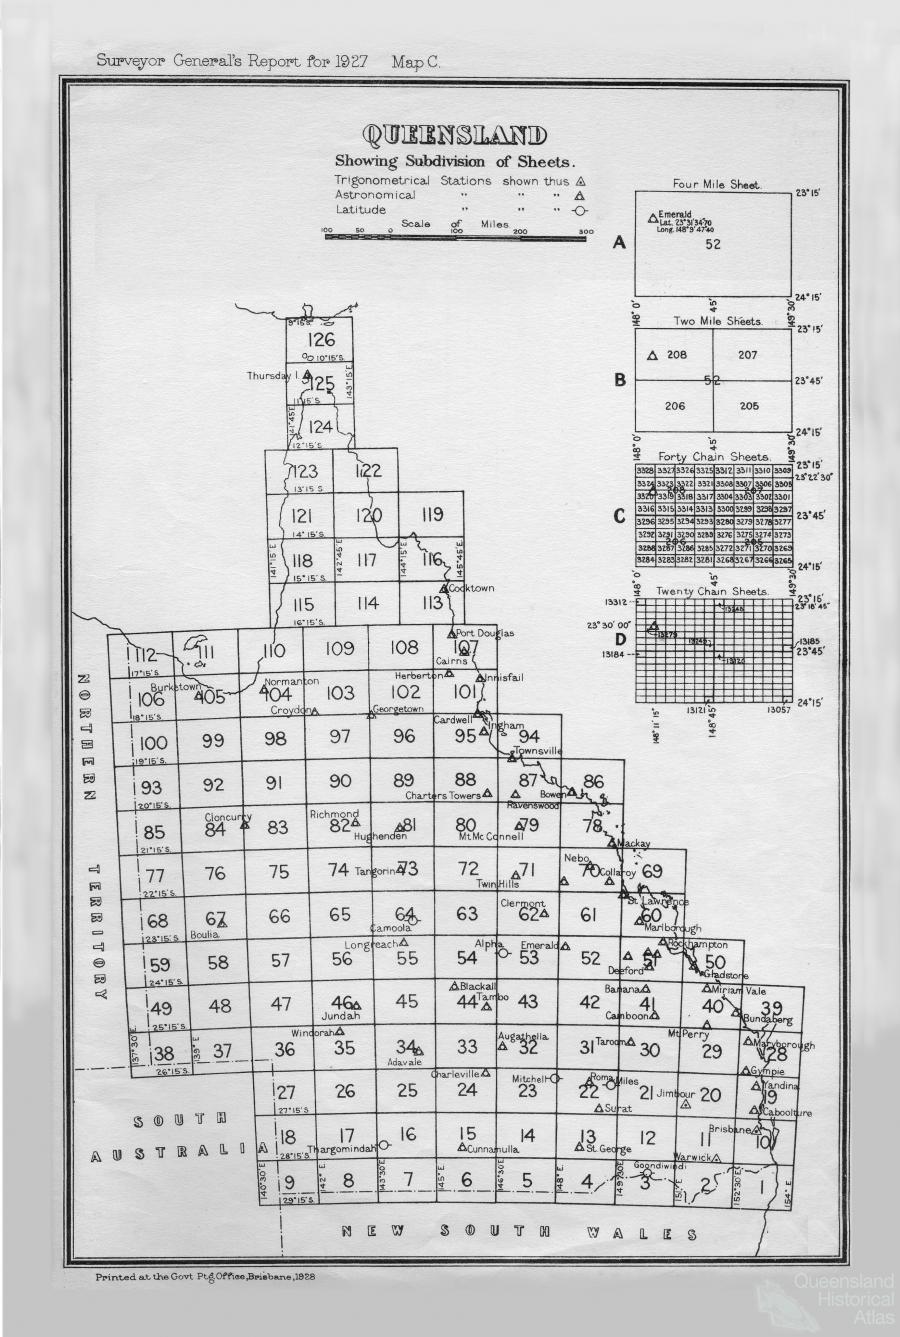
In western Queensland, where properties were more extensive, mapping scales adopted were 2 miles to one inch and 4 miles to one inch. Whilst the irregular shaped maps of Counties and Parishes suited land tenure administration, the economic argument for systematic rectangular sheet map coverage prevailed. Sheet systems prior to and following the radical changes in Queensland in 1927 prepared the way for later adoption of international standard map formats.
At that time, astronomical stations were established in towns remote from the trigonometrical stations in south-eastern Queensland, to avoid inaccuracies caused by extending the map coverage incrementally.
Urban areas of the state were mapped at larger scales. Sheet maps at 40 chains to one inch covered the Brisbane region, and similar coverage was achieved in other urban areas. However, the task of mapping at scales sufficiently large to administer residential properties often fell to local authorities. For example, Greater Brisbane area was mapped at 4 chains to one inch by the Brisbane City Council, and private draftsmen mapped other centres.
Thematic maps
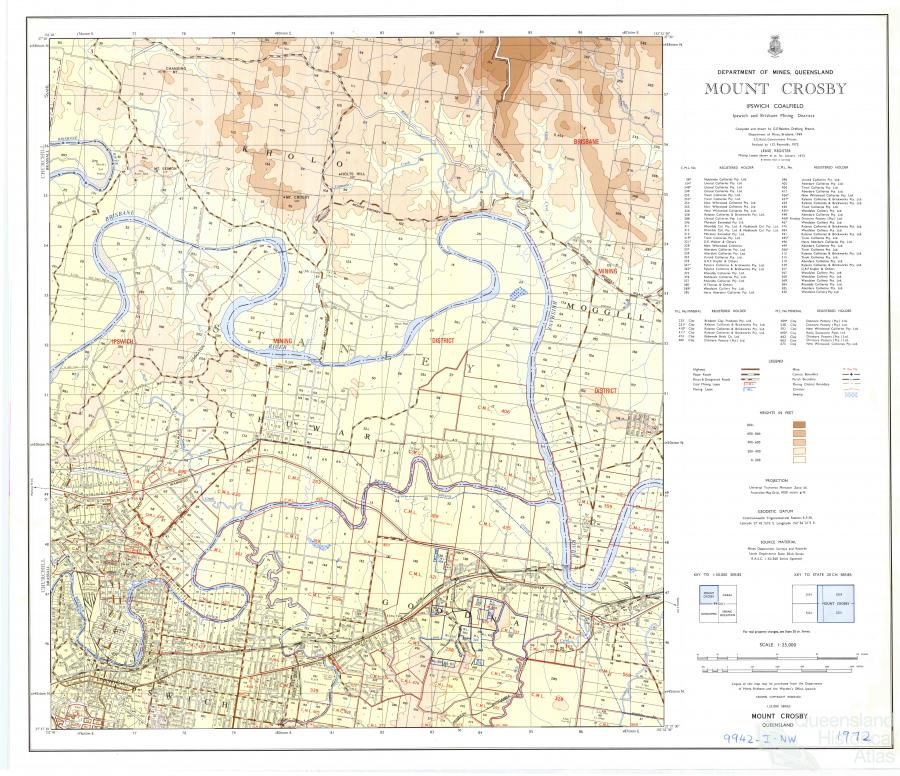
The importance of the timber industry in Queensland necessitated special mapping by the Forestry Department for administration of forestry reserves, national parks and the timber industry. Similarly, the Mines Department produced geological maps of the state, together with property boundary maps of mining tenures. Maps and plans were produced by the Railways Department. The Irrigation Commission provided maps for the management of the state’s water resources. Coastal navigation charts were the responsibility of the Department of Harbours and Marine. Hydrographic charts were produced by the British Admiralty up to 1921, then the Royal Australian Navy Hydrographic Service.
By the late 1920s many businesses had acquired a truck and some people could afford a car, creating a demand for road maps. This market for ‘strip maps’ was met pre-eminently by the motoring organisation RACQ (Royal Automobile Club of Queensland), and by private mapmakers. This included the growing need for street directories, of which the Refidex was the earliest in Brisbane.
World War II made new demands for operational maps, at a time when many of the drafting personnel of the Survey Office became members of the armed forces, many to serve in the Royal Australian Survey Corps. The war revealed the gross inadequacy of Australia’s maps for defence purposes. It was a national problem, and was met with a national response, in the creation of the National Mapping Council from a conference of the Commonwealth Survey Committee and the State Surveyors General in 1945. The mapping program for Australia, co-ordinated by the Council, was carried out by the States in conjunction with the Division of National Mapping, and the Australian armed services. It provided for maps at metric scales decided according to the density of settlement and strategic importance.
Accelerating change
By 1955, with a staff of eight, the Survey Office was the only organisation in Queensland with staff and equipment for photogrammetric work. Through the 1960s, in Queensland the systematic topographic mapping of the state, was involving around ten per cent of Survey Office personnel. The work included ground control surveys, photogrammetry and cartography, to agreed national specifications. Project mapping for all State Government purposes employed aerial photography carried out by commercial contractors.
Cadastral mapping continued. In 1975 the Survey Office was separated from the Lands Department. It was soon designated the Department of Mapping and Surveying, and later became the Department of Geographical Information. This brought a wider scope to government mapping of Queensland. One map product in particular offered a solution to the difficult question of providing large scale maps for infrastructure planning and land development projects by local authorities. This was the orthophoto, which achieved planimetric accuracy in photographic imagery.
In Queensland the tourist industry had grown by 1980 to the point where special tourist maps were produced by the state mapping agency at the behest of the Tourist and Travel Corporation. Multicoloured state and regional maps resulted from this program.
Scale
On entry into the twentieth century, Queensland maps at large and small scales were in use, ‘large’ in the sense that detail appeared large on the map, as in town plans, ‘small’ scale maps (a relative term) serving for maps of the state or substantial parts of it. Metrication began in Australia in 1966, and slowly worked its way through all measurement systems. Up till then, Australian maps used ‘Imperial’ units, as in 2 miles to an inch. The increasing standardisation of world mapping practice led to the adoption of Representative Fraction (RF) scales, in the above case 1:126,720. Progressively, Imperial scale maps were reissued at the nearest suitable metric scale (eg 1:100,000). Sheet series over time were converted to the geographical boundaries coming into use world-wide, with widespread adoption of UTM, the Universal Transverse Mercator projection.
Map reproduction
From the time of Separation in 1859, reproduction of Survey Office maps used lithography, with greasy ink on stone slabs, printing monochromes at a rate of 300 prints per hour, compared to modern ‘offset’ printing rates of 18,000 multicolour prints per hour. The system went through upgrades including photo-lithography. It was not superseded by offset printing from zinc plates until 1932.
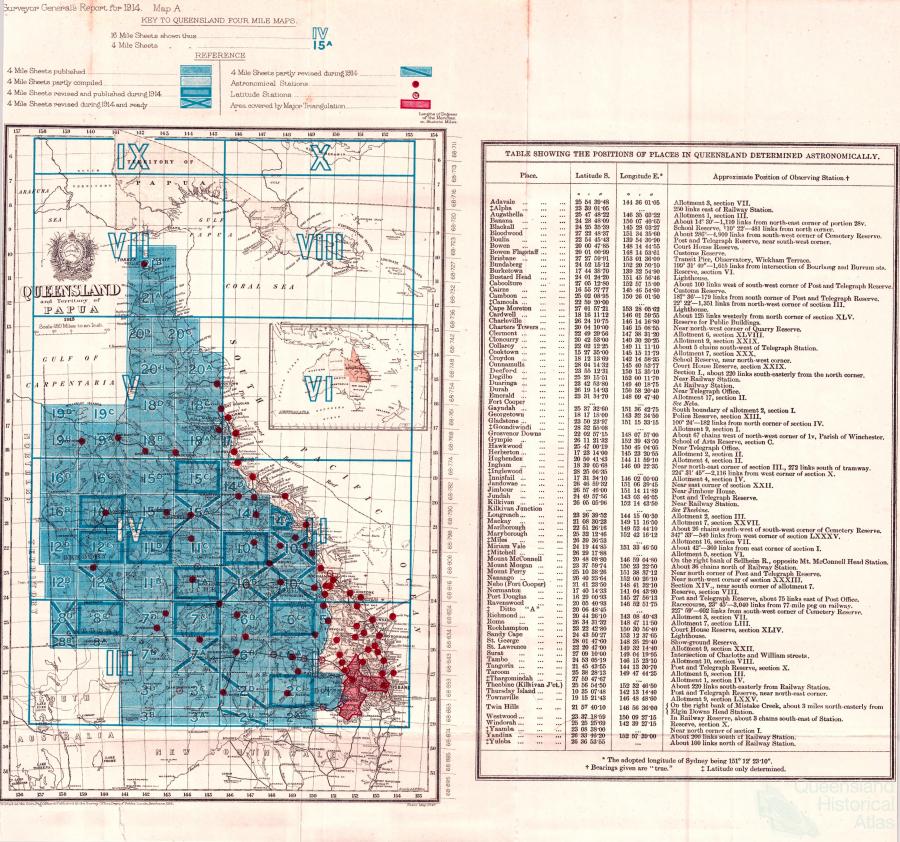
Geodetic control
In 1891 the new Surveyor General Archibald McDowall saw the need to fix positions of remote western towns beyond the reach of the existing triangulation network, and advocated the use of astronomical determination of position as a basis for local mapping. This became a national issue with interstate agreement in 1912 on the need for a national geodetic survey, which the Commonwealth should undertake. As part of a general reorganisation of Queensland mapping in 1927, the precise location of remote western Queensland towns was achieved through astronomical observations, using wireless broadcast time signals in Queensland for the first time. From a radio tower adjoining the Survey Office Observatory in Brisbane, at the corner of George and Elizabeth Streets, station 4QG transmitted signals to geodetic surveyors in the field. Determination of longitude by this means was a great improvement on techniques using local chronometers. Precisely timed astronomical observations were key to the location problem, since longitude is a measure of the angle of rotation between the observer and a reference meridian, such as Greenwich.
Post-World War II measurement of distances employed the remote sensing sciences developed during the war. The Tellurometer (using radio wave signals) and the Geodimeter (using light) enabled long-line measurement. Trilateration brought a new rigor to the State triangulation network. By 2009, positional accuracy by GPS satellite – Geodetic Position System – had become incredibly refined and precise. GPS positioning is now available to the general public via in-car navigation devices and mobile telephones – an extraordinary contrast with the complex procedures of the past, known by only a few.
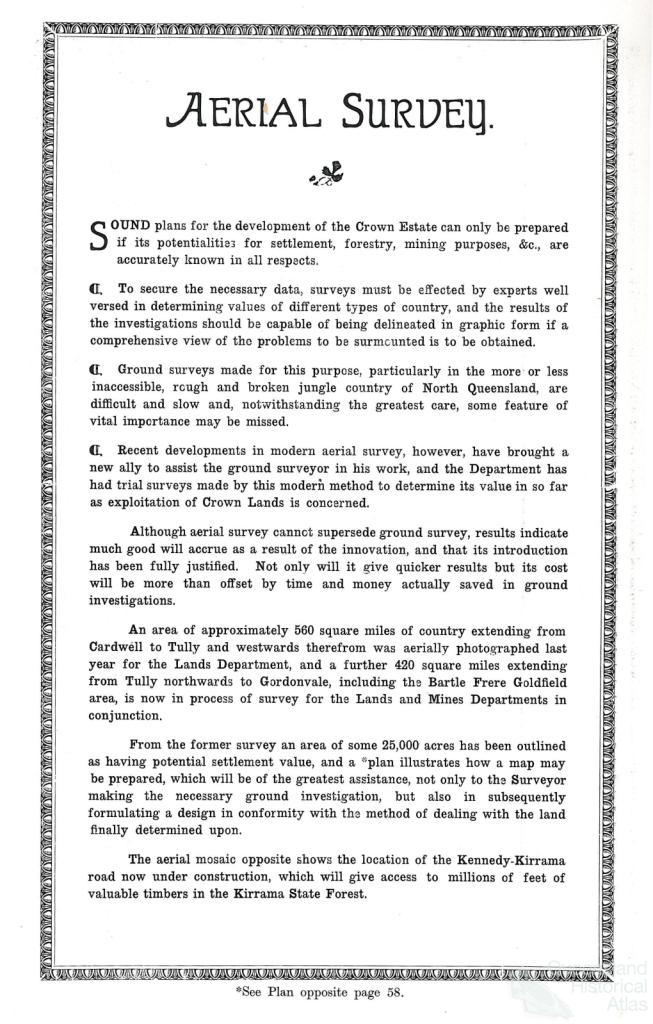
Photogrammetry
The rapid development of aerial photography and photogrammetry under the pressures of World War II transformed mapping technology. Aerial surveys called for great precision in both the cameras acquiring the images and the stereoplotting instruments used in extracting map detail in three dimensions. Early anaglyph systems employed red and green filters on projecting and viewing lenses to view a stereographic pair of photos together. Larger photograph formats (diapositives) were possible in later machines which used an optical train to reconstruct the three-dimensional image (model) of the earth. The same technology served for mapping the moon in 3D, and terrestrial objects from buildings to microbes. The speed and scope of aerial surveying is in stark contrast to the plane-table surveying which it replaced. Derivative systems produced orthophoto maps, which differentially enlarged or reduced the original image, by tiny sections, according to altitude, and so achieved uniform scale.
It was now possible to match exactly the line map detail, cadastral and topographic, with a photograph of the same area from which all scale distortions due to height had been removed. This satisfied many engineering and planning uses, and avoided costly detail plotting. Cartographic enhancement was minimised, and photographic detail interpretation was left to the user. Local authorities in Queensland were offered cost-sharing arrangements for the mapping of their shires in systematic coverage at scale 1:2500.
Related:
Perceptions